Shared search · Sep 9, 2026
How do BI tools like Power BI or Tableau track where their dashboard visual metrics come from?
BI tools generally track a dashboard metric through a layered lineage chain:
Source system → tables/columns → semantic model or data source → calculated metric → visual → dashboard
For example:
ERP.Sales.OrderAmount → Sales table → [Total Sales] measure → KPI card → Executive Dashboard
Power BI
Power BI records metadata about:
- Connected databases, files, APIs, and dataflows
- Tables, columns, relationships, and transformations in Power Query
- Semantic models and datasets
- DAX measures, calculated columns, and calculated tables
- Report pages, visuals, filters, and slicers
- Workspace, app, and report dependencies
Useful features include:
- Lineage view: shows relationships among data sources, dataflows, semantic models, reports, dashboards, and apps.
- Impact analysis: identifies reports or dashboards that may be affected if a model or field changes.
- Show as a table / visual data inspection: helps reveal the fields, filters, aggregations, and values used by a visual.
- Model and measure metadata: exposes the DAX definition of a measure, such as:
1Total Sales = SUM(Sales[Amount])
Power BI’s lineage is especially strong when metrics are defined centrally in a shared semantic model. A report visual typically references a model measure rather than independently redefining the calculation.
Tableau
Tableau tracks metadata at the workbook and data-source levels, including:
- Databases, files, and tables
- Data-source connections and extracts
- Fields used in worksheets
- Calculated fields and parameters
- Filters, joins, relationships, and blends
- Worksheets, dashboards, and stories
- Published data sources and downstream workbooks
Common capabilities include:
- Data source pages showing field definitions and connection information
- Workbook and field usage information
- Tableau Catalog lineage, where licensed and configured, showing upstream sources and downstream dependencies
- View Data / Describe features for inspecting the fields, calculations, filters, and underlying records behind a mark or visual
Tableau calculations can be defined directly inside a workbook, in a published data source, or upstream in a database or transformation pipeline. Therefore, the same metric name can potentially mean different things in different workbooks unless organizations use governed published data sources.
What lineage usually tells you
For a visual metric, lineage can often answer:
- Which source column supplied the data?
- What joins, relationships, or transformations were applied?
- Which filters and date ranges affect the number?
- What aggregation was used—sum, average, count, distinct count, etc.?
- What calculation or formula produced it?
- Which reports depend on the underlying field or model?
- When was the data last refreshed?
Important limitation
Technical lineage does not automatically explain the business meaning of a metric.
For example, lineage may show:
1SUM(Sales[Amount])
but not whether “sales” means:
- Gross sales or net sales
- Orders placed or orders shipped
- Revenue before or after refunds
- Local currency or converted currency
- Current customers only or all customers
That meaning must be documented separately using a semantic layer, certified metrics, data catalog, descriptions, owners, and governance rules.
Also, lineage can become incomplete when logic is hidden in:
- SQL views or stored procedures
- Custom SQL
- Python or R scripts
- Manual spreadsheet uploads
- Embedded dashboards
- Third-party ETL tools
- Extracts whose upstream logic is not exposed
So BI lineage is best understood as metadata-based dependency tracking, not a perfect audit trail. Power BI tends to emphasize model-level lineage, while Tableau often exposes lineage through published data sources, workbooks, and Catalog. 1
Related
What is the difference between data lineage and metric governance?
Data lineage and metric governance answer different questions:
| Aspect | Data lineage | Metric governance |
|---|---|---|
| Core question | “Where did this data or number come from, and what happened to it?” | “What does this metric mean, who owns it, and how may it be changed or used?” |
| Primary focus | Technical flow and dependencies | Business meaning, consistency, accountability, and control |
| Typical scope | Sources, pipelines, tables, columns, transformations, models, reports | Definitions, formulas, filters, owners, approvals, quality thresholds, versions |
| Main output | A traceable path or dependency graph | An approved, documented, consistently managed metric |
| Example | CRM → warehouse → SQL model → Power BI dataset → dashboard | “Pipeline is the value of qualified opportunities open at month-end, excluding renewals; RevOps owns the definition.” |
Data lineage follows data from its origin through transformations and calculations to its destination, such as a dashboard or KPI. 2 Metric governance establishes standards so metrics are clearly defined, consistently calculated, owned, validated, and subject to controlled changes.
9
Example
Suppose a dashboard displays Monthly Recurring Revenue (MRR).
- Lineage might show that MRR comes from Stripe and Salesforce, passes through several warehouse models, excludes certain records, and is finally calculated in a BI semantic model.
- Metric governance determines that MRR:
- excludes one-time charges and taxes;
- includes upgrades but not unpaid invoices;
- is reported in USD;
- has Finance as the business owner;
- uses one approved formula;
- requires review before its definition changes.
In short:
Lineage explains the metric’s journey. Governance controls the metric’s meaning and use.
They work together. Lineage provides the evidence needed to validate a governed metric and assess the effect of changing an upstream source. But lineage alone cannot tell you whether “revenue,” “active customer,” or “churn” has the correct business definition. That requires governance.
A practical metric record often combines both:
1Metric: MRR2Business definition: ...3Formula: ...4Owner: Finance5Approved source: Revenue model6Quality checks: ...7Version: 38Lineage: Stripe → warehouse → revenue model → BI dashboard
Related
How does blockchain technology ensure immutable and tamper-proof data provenance?
Blockchain makes data provenance tamper-evident and difficult to rewrite through several mechanisms:
-
Cryptographic hashes
A record is converted into a fixed-length digital fingerprint. Changing even one character changes the hash, revealing that the record no longer matches its original version. Blocks also contain the previous block’s hash, linking records into a chain.5
8
-
Digital signatures and identities
The party submitting an event signs it with a private key. Others can verify the signature with the corresponding public key, providing evidence of who submitted the record and detecting unauthorized alterations.2
-
Timestamped, append-only records
New events are added as subsequent entries rather than silently overwriting earlier ones. This creates a chronological history—for example, creation, transfer, inspection, and delivery events in a supply chain.1
-
Distributed replication
Multiple network participants maintain copies of the ledger. An attacker cannot normally alter one copy without conflicting with the copies held elsewhere.4
-
Consensus
The network uses a consensus protocol—such as proof of work, proof of stake, or an authorized-participant voting process—to agree which transactions are valid before adding them. The ledger’s integrity therefore does not depend solely on one database administrator.7
-
Merkle trees and efficient verification
Many blockchains summarize transactions with a Merkle tree. A verifier can check that a particular record belongs to a block without downloading every transaction, helping prove that the record has not been changed.
Example
For a shipment, a system might record:
1Product ID + factory + timestamp + inspection result2 ↓3Hash and digitally sign the event4 ↓5Validate through consensus6 ↓7Add to the ledger
A later user can compare the supplied shipment data with the recorded hash and verify the submitting party’s signature. If the data was altered after recording, the hash or signature check fails.
Important limitation
“Immutable” does not mean the information is automatically true. Blockchain protects the integrity of what was recorded; it does not prove that a sensor, employee, oracle, or data-entry system supplied accurate information. This is often called the garbage-in problem.
Blockchain also does not necessarily store the underlying file or dataset. Many systems store the data off-chain and put only its hash, identifier, or proof on-chain. In that design, deleting or changing the off-chain file may make it unavailable—even though the blockchain still shows that a different version originally existed.
Finally, immutability is relative to the network’s security model: a compromised majority of validators, stolen signing keys, flawed smart contracts, or an overly centralized permissioned network can undermine provenance guarantees. Thus blockchain provides tamper evidence, shared history, and verifiability, but trustworthy provenance still requires sound identity controls, reliable data capture, governance, and operational security. 6
7
Related
How can security analysts trace the geographic and network origin of incoming malicious data packet flows?
Security analysts usually separate network origin—the address, provider, and path visible on the Internet—from physical or geographic origin, which may be hidden or only estimated.
Typical investigation workflow
-
Capture and preserve the traffic
- Collect packet captures from network TAPs, SPAN ports, firewalls, IDS/IPS, routers, load balancers, and cloud flow logs.
- Record timestamps in UTC, source and destination IPs, ports, protocols, packet sizes, TCP flags, DNS names, TLS metadata, and session identifiers.
- Flow data helps map traffic volume and packet journeys, while packet data provides deeper details for investigating suspicious activity.
2
-
Validate the apparent source
- Check whether the source IP is routable, private, reserved, or otherwise suspicious.
- Look for spoofing indicators such as impossible TCP behavior, inconsistent TTLs, malformed headers, and large volumes of connectionless traffic.
- For high-volume attacks, source IPs may be forged; ingress filtering is specifically designed to prevent forged source addresses from propagating through networks.
9
-
Identify the responsible network
- Map the IP to its Autonomous System Number (ASN), announced prefix, ISP, cloud provider, hosting company, and abuse contact.
- Use RIR WHOIS/RDAP records, routing registries, BGP data, reverse DNS, and passive DNS. For example, the RIPE Database contains registration information for IP addresses, AS numbers, organizations, and network contacts.
18
- This identifies the network that originated or transited the traffic—not necessarily the individual attacker.
-
Estimate geographic location
- Query several IP-geolocation sources and compare country, region, city, hosting-provider, and confidence information.
- Treat the result as an estimate. Geolocation databases use registration data, BGP, probing, and other sources, and their precision varies significantly.
29
- A result such as “cloud provider, Singapore” should generally be interpreted as the apparent egress point or hosting location, not proof that the attacker was physically there.
-
Reconstruct the route
- Compare observed traffic with BGP announcements and use controlled traceroute or provider-side telemetry where appropriate.
- Trace from multiple vantage points because Internet routing is asymmetric and paths can change.
- For serious incidents, request logs or traceback assistance from the upstream ISP, transit providers, CDN, cloud provider, or hosting company. Network forensics combines captured, recorded, and analyzed traffic to establish attack origins and reconstruct events.
4
-
Correlate with internal and external evidence
- Match packet timestamps against NAT/CGNAT logs, VPN and proxy logs, DHCP leases, authentication events, DNS logs, endpoint telemetry, and application logs.
- Enrich indicators with threat-intelligence data: known botnet infrastructure, malware domains, certificate reuse, hosting patterns, passive DNS, and related IPs.
- Use behavioral analytics and network-flow monitoring to distinguish a single source from a distributed campaign.
5
-
Preserve evidence and escalate appropriately
- Retain original captures, hashes, synchronized timestamps, chain-of-custody records, and query results.
- Contact the provider’s abuse team with exact timestamps, source IP/port, destination, protocol, evidence, and relevant packet samples.
- If attribution to a person or organization is required, involve legal authorities; providers may hold the subscriber, NAT, or account records needed for attribution.
What analysts can and cannot conclude
| Evidence | Usually supports | Does not prove |
|---|---|---|
| Source IP | Apparent sending endpoint or egress point | Attacker’s identity or physical location |
| ASN/WHOIS | Registered network or provider | Who controlled the system at that moment |
| IP geolocation | Approximate network/hosting location | Exact city or attacker location |
| Traceroute/BGP | Routing path and transit networks | The complete reverse path |
| NAT/VPN/cloud logs | Possible user or tenant behind an address | Attribution without provider and timeline confirmation |
| Packet behavior | Malware family, tooling, or attack technique | Legal identity of the operator |
The key limitation is that attackers can use VPNs, proxies, VPSs, compromised hosts, tunnels, and spoofed addresses. CISA states that the true physical location cannot be determined from IP geolocation alone, even when the geolocation itself is accurate. 29 Therefore, analysts should report confidence levels—for example, “traffic entered from a VPS in an ASN registered to provider X”—rather than claiming “the attacker was in country Y.”
Related
How does IP geolocation work and how accurate is it?
How IP geolocation works
IP geolocation estimates where an Internet connection or network endpoint is located by mapping its public IP address to geographic and network data. It is not GPS and usually identifies the network’s approximate location—not the precise location of a person or device.
Geolocation providers combine several signals:
- Regional Internet Registry (RIR) records: Registration data from organizations such as ARIN, RIPE NCC, and APNIC provides the country or region associated with an IP block.
- ASN and BGP routing data: The IP is linked to an autonomous system, announced prefix, ISP, cloud provider, or hosting company. This helps identify the network operating or advertising the address.
- ISP and commercial databases: Providers maintain proprietary mappings based on network deployment information, customer data, and historical observations.
- Latency and traceroute measurements: Network delay and routing paths can help estimate proximity to an endpoint, although Internet routes are indirect and asymmetric.
- DNS and other signals: Reverse DNS names, passive DNS, Wi-Fi or mobile signals, and user-contributed measurements may improve the estimate.
3
4
A lookup service typically returns some combination of country, region, city, latitude/longitude, ISP, ASN, organization, connection type, and confidence indicators.
How accurate is it?
Accuracy decreases rapidly as the requested location becomes more specific:
| Level | Typical reliability |
|---|---|
| Country | Often reasonably reliable, especially for stable fixed-line addresses |
| State/region | Variable; depends on the ISP and quality of local mapping |
| City | Frequently approximate and may point to an ISP hub or nearby major city |
| Street address or person | Generally not possible from an IP address alone |
Some commercial estimates report roughly 95–99% country-level accuracy, 75–85% at region level, and 50–75% at city level, but these figures vary by provider, country, IP type, and measurement method; they should not be treated as universal guarantees. 4
The latitude and longitude returned by an API may be a database reference point, such as an ISP office, exchange, or geographic centroid, rather than the user’s actual position. IP addresses do not normally provide home-address precision. 2
4
Why results can be wrong
- VPNs, proxies, Tor, and remote desktops: The lookup usually identifies the intermediary or exit node.
- NAT and carrier-grade NAT: Many users can share one public IP, so the address cannot identify an individual subscriber.
- Mobile networks: Users move between gateways, and the mapped location may be broad or unstable.
- Cloud and hosting providers: An IP may locate a data center, not the person operating a workload.
- Dynamic reassignment: ISPs can move addresses between customers or locations, while databases may lag behind.
- Corporate networks: Traffic may exit through a centralized gateway far from the employee or device.
- Spoofed source addresses: Some malicious traffic can contain forged source IPs, particularly connectionless traffic; in that case, geolocation describes neither the attacker nor necessarily the sending system.
How to use it responsibly
For security investigations, treat IP geolocation as contextual evidence, not attribution. Combine it with:
- ASN, WHOIS/RDAP, BGP, and reverse-DNS information
- VPN, proxy, Tor, cloud, and residential-proxy detection
- Firewall, NAT, VPN, DHCP, authentication, and endpoint logs
- Timestamps and provider records
- Results from multiple geolocation databases
A defensible conclusion is usually: “The traffic exited through an IP assigned to a hosting provider in this approximate region.” It is not: “The attacker was physically located at this address.” CISA likewise cautions that physical location cannot be determined from IP geolocation alone. 5
Related
How is digital watermarking used to track the unauthorized leaks of confidential files and datasets?
Digital watermarking helps identify which authorized copy was leaked. It usually does not prevent copying; instead, it creates a traceable link between a distributed file and its recipient or distribution event. 5
How the process works
-
Create a unique fingerprint for each recipient
- Assign a cryptographically random identifier to each user, organization, download, or viewing session.
- Maintain a protected mapping between that identifier and the recipient, access time, permissions, and file version.
- This is called forensic watermarking, transaction watermarking, or traitor tracing.
11
-
Embed the identifier into each copy
- For documents, the mark may be encoded in layout elements, characters, metadata, images, whitespace, or document structure.
- For images, audio, and video, it is usually embedded into pixels, transform coefficients, samples, or frames.
- For datasets, the system can make carefully controlled changes to selected records, values, ordering, or generated synthetic data. Database fingerprinting gives each recipient a slightly different copy while attempting to preserve usability.
16
-
Distribute individualized copies
- Instead of sending the same “confidential.xlsx” to everyone, the organization generates a distinct watermarked version for each approved recipient.
- Visible labels—such as recipient name, account, date, or “confidential”—act as a deterrent, while invisible marks preserve usability and can support later investigation.
10
24
-
Monitor for leaked copies
- Search websites, code repositories, file-sharing services, social media, public cloud buckets, and dark-web sources for matching content.
- Detection tools can scan suspicious files or extracts for the hidden identifier. Watermarks in visual assets can be designed to survive operations such as compression, resizing, cropping, and color filtering.
3
-
Extract and resolve the watermark
- An authorized detector uses a secret key or controlled service to recover the embedded identifier.
- Investigators then map it to the recipient and correlate it with download logs, access records, DLP alerts, endpoint telemetry, and timestamps.
- The result is a strong investigative lead: “the leaked copy corresponds to recipient B’s distribution.”
Applying it to datasets
For structured data, watermarking must balance traceability against data utility and accuracy:
- Numeric data: Make tiny, bounded changes to selected values while preserving acceptable analytical error.
- Categorical data: Alter selected values only where an equivalent or semantically safe representation exists.
- Relational databases: Embed a recipient-specific pattern across many rows or attributes rather than relying on one record.
- Synthetic datasets: Generate a distinct marked version for every recipient.
- Large data files: Place redundant marks throughout the dataset so that partial extracts can still contain enough evidence for detection.
Privacy and liability are separate design goals: sanitizing a dataset protects privacy, while unique fingerprint insertion supports accountability. Combining them carelessly can reduce utility, so privacy-preserving fingerprinting methods aim to provide both guarantees with less degradation. 20
Watermark types
| Type | Main purpose |
|---|---|
| Visible watermark | Deters casual sharing and identifies the authorized recipient |
| Invisible robust watermark | Allows tracing after normal transformations |
| Fragile watermark | Detects modification or tampering, but may break after ordinary edits |
| Metadata marker | Easy to implement, but easy to strip |
| Cryptographic fingerprint | Binds a copy to a recipient or transaction and supports controlled verification |
Important limitations
- A watermark can be removed, damaged, or obscured, particularly by reformatting, screenshots, OCR, paraphrasing, row deletion, value modification, or recompressing media.
- If several recipients collude and combine their copies, they may try to eliminate the distinguishing marks; database fingerprinting research explicitly considers robustness against such manipulation.
19
- A watermark normally identifies the source copy, not necessarily the person who physically leaked it. The recipient’s credentials could have been shared, stolen, or compromised.
- A watermark does not by itself prove that the file is authentic, unmodified, or legally attributable; those questions require hashes, signed provenance, access logs, and chain-of-custody records.
- Encoding personal information directly into a visible or hidden mark can create privacy and employment-law concerns.
Best-practice design
Use watermarking as one layer in a broader control system:
- Generate a different mark per recipient or session.
- Keep the recipient-to-mark mapping in a secure, access-controlled audit system.
- Use a keyed detector and restrict who can perform extraction.
- Add redundancy so the mark survives likely transformations.
- Test against cropping, screenshots, conversion, record deletion, aggregation, and collusion.
- Combine it with encryption, least-privilege access, DLP, download controls, logging, and leak monitoring.
- Preserve the original file, marked copy, embedding record, detector output, hashes, and timestamps for evidentiary use.
In short, watermarking is most effective when it makes every authorized distribution individually identifiable, then combines detection of the leaked mark with independent access and audit evidence.
Related
How does a Data Mesh architecture handle data ownership and sourcing at the domain level?
 amazon1Data Mesh Architecture
A Data Mesh moves responsibility for analytical data from a central data team to the business domains that understand and generate it. It is built around four principles: domain-oriented ownership, data as a product, self-serve platform infrastructure, and federated governance. 4
Domain-level ownership
Each domain—such as Sales, Payments, Customer Support, or Supply Chain—owns the data products associated with its business capabilities. Ownership generally includes:
- Defining business meaning, terminology, and permitted use
- Ingesting data from the domain’s operational systems
- Transforming and serving analytical data
- Maintaining quality, freshness, availability, and documentation
- Managing access, privacy, retention, and compliance
- Supporting consumers and meeting published SLAs
The domain team is accountable because it is closest to both the source systems and the business context. This avoids a centralized team having to infer meaning or repeatedly negotiate changes with data producers. 3
Ownership is about accountability, not necessarily exclusive physical storage. A platform team may provide the lakehouse, catalog, pipelines, identity controls, and deployment tooling, but the domain remains responsible for the data product’s content and behavior.
How sourcing works
1. Source-aligned data products
The default pattern is a source-aligned data product: the domain publishes cleaned, governed analytical data created by or belonging to that domain.
For example:
- Orders domain: orders, order status, fulfillment events
- Payments domain: payment attempts, settlements, refunds
- Customer domain: customer identities and profile attributes
The domain typically captures data from its own systems of record, applies domain-specific transformations, and publishes an interface for consumers. The goal is not for a central team to copy raw tables into a warehouse and then own all downstream transformations; domains are expected to handle ingestion, transformation, and serving for their products. 2
10
Source-aligned products should normally remain authoritative for facts the domain creates. A Marketing team might consume the Payments domain’s refund product rather than independently rebuilding “refund logic” from a replicated transaction table.
2. Consumer-aligned data products
Some products are created for a specific analytical use case rather than directly representing one source domain. For example, a Customer Lifetime Value product may combine Sales, Payments, and Marketing data.
In that case, the consuming team or use-case owner generally owns the resulting product because it owns:
- The analytical purpose
- The business logic and definitions
- The required quality and timeliness
- The product’s consumer-facing contract
The upstream domains still own and publish their source-aligned products; the consumer-aligned team composes them rather than taking ownership of the underlying source facts. 9
3. Cross-domain or shared products
For broadly used products—such as a Customer 360 view—organizations may create a dedicated ownership group or “virtual” domain. This prevents ambiguous shared ownership while recognizing that the product serves multiple domains and combines data from several sources. 9
Governance model
Data Mesh is decentralized, but it is not ungoverned. Governance is federated:
- Domain teams make local decisions and implement data products.
- A cross-domain governance group defines organization-wide rules for security, privacy, interoperability, naming, metadata, quality, and compliance.
- The self-serve platform team turns those rules into reusable, automated capabilities.
This allows domains to work independently while ensuring that their products can be discovered, accessed, combined, and governed consistently. 4
8
A simple responsibility split
| Responsibility | Primary owner |
|---|---|
| Business meaning and source facts | Producing domain |
| Ingestion from domain systems | Producing domain |
| Product quality and SLA | Product-owning domain |
| Cross-domain analytical model | Consumer or dedicated product owner |
| Platform infrastructure and tooling | Central platform team |
| Organization-wide standards | Federated governance |
| Access approval | Domain owner plus security/privacy controls |
In short: a Data Mesh treats each domain as a data-product provider. The producing domain sources and manages its own authoritative data, while consuming domains compose those products for specialized use cases. Central teams provide the platform and guardrails—not centralized ownership of every dataset.
Related
"How does Reverse ETL move processed analytics data back into operational source systems?
Reverse ETL takes cleaned, modeled, or computed data from a warehouse/lakehouse and synchronizes it into the operational applications where employees and automated workflows act on it. It reverses the usual direction—rather than loading operational data into analytics, it sends analytics back to operations. 1
4
How the flow works
-
Prepare the analytical data
Data is first ingested from operational sources, cleaned, joined, and modeled in the warehouse. Examples include a customer-health score, churn probability, customer lifetime value, or an enriched customer profile. -
Select records to activate
A reverse-ETL job queries a warehouse table or view and identifies the records to send. It may send:- All eligible records on a schedule
- Only rows changed since the previous run
- Records entering or leaving a segment
- Event-triggered updates for near-real-time use
-
Map analytical fields to the destination
The pipeline maps warehouse columns to fields in a CRM, marketing platform, support desk, ERP, or another application. It also converts formats, applies business rules, and resolves identities—for example, matching a warehousecustomer_idto a CRM contact ID. -
Write through the destination interface
The connector sends records through the destination system’s API, bulk-import mechanism, or database interface. It commonly performs upserts—updating an existing record or creating it if it does not exist—rather than blindly inserting duplicates. -
Use the result operationally
The receiving system exposes the data to staff or uses it to trigger actions. For example:- A CRM displays a customer’s predicted churn risk to an account manager.
- A marketing platform adds high-propensity customers to a campaign.
- A support system shows lifetime value or risk context to an agent.
- An operations application initiates a workflow based on a score or status.
4
-
Monitor and reconcile the sync
Production implementations track successful and failed writes, retries, API limits, schema changes, timestamps, and row counts. They should also reconcile the destination with the warehouse and make writes idempotent so rerunning a job does not create duplicate or inconsistent records.
Example
1CRM, billing, product usage2 ↓3 ETL / ELT pipelines4 ↓5Warehouse model:6customer_id | health_score | churn_risk | segment7 ↓8Reverse ETL connector9 ↓10CRM fields, campaign audience, support profile11 ↓12Sales, marketing, and support actions
The key is that the warehouse remains the place where the metric or segment is calculated, while the operational system becomes the place where the result is consumed. Reverse ETL therefore turns analytics from dashboard-only information into an input for everyday workflows. 1
7
Important safeguards
- Do not automatically overwrite authoritative transactional fields unless ownership and conflict rules are explicit.
- Prefer dedicated destination fields such as
analytics_churn_scoreorwarehouse_customer_segment. - Define freshness expectations: hourly, daily, or near real time.
- Validate data quality before transmission because bad analytical data can directly affect customer interactions or automated decisions.
1
- Secure both the connector credentials and the data in transit.
- Record lineage showing which warehouse model, run, and timestamp produced each operational value.
In short, Reverse ETL is an activation and synchronization layer: it extracts trusted analytical outputs, adapts them to an operational system’s schema, writes them through a controlled interface, and makes them available for human or automated action.
Related
How do IoT edge devices record, timestamp, and stream raw physical environment data to the cloud? https://lastdatabase.com
IoT edge devices typically use a sensor → edge device/gateway → cloud pipeline to capture and transmit physical-environment data such as temperature, humidity, pressure, vibration, light, air quality, or sound.
1. Recording raw sensor measurements
A sensor periodically samples a physical property and converts it into a digital value using a sensor interface or analog-to-digital converter. The edge device then records the measurement along with metadata such as:
- Device and sensor ID
- Measurement value and unit
- Sampling rate and sequence number
- Location or facility
- Sensor quality or calibration status
- Battery and device health
- Firmware and schema version
Adding identifiers, timestamps, location, and sensor type gives the cloud enough context to interpret otherwise meaningless numeric readings. 2
A typical raw record might look like:
1{2 "device_id": "weather-station-07",3 "sensor_id": "temp-01",4 "observed_at": "2026-09-09T14:32:10.245Z",5 "temperature_c": 27.4,6 "sequence": 184203,7 "quality": "good"8}
2. Timestamping measurements
The device should distinguish between at least two times:
- Event time / observed time: when the sensor actually took the reading
- Ingestion or transmit time: when the edge device or cloud received it
The device usually obtains event time from a real-time clock, synchronized through NTP, GNSS/GPS, or another time source. If the clock is unsynchronized, the record should include a clock-quality indicator or synchronization status.
This distinction matters because readings can arrive late or out of order. In streaming systems, ingestion timestamps help preserve the order in which data entered the pipeline, while event timestamps represent when the physical event occurred. 7
For reliable records, systems commonly add:
1event_time = when the sensor sampled the environment2edge_received_at = when the gateway received the reading3cloud_received_at= when the cloud ingested it4sequence_number = device-local ordering
Sequence numbers are useful for detecting missing, duplicated, or reordered messages.
3. Local edge processing
Before transmission, the edge device or gateway may:
- Validate ranges and sensor status
- Add metadata and normalize units
- Deduplicate readings
- Compress or batch records
- Filter noise or irrelevant samples
- Detect local anomalies
- Trigger immediate safety actions
- Store data temporarily during network outages
Edge processing reduces latency and bandwidth usage, and it allows local decisions even when cloud connectivity is unavailable. 1
3 However, if the requirement is to preserve raw physical data, the device should retain the original reading before filtering or transformation, either locally or in a gateway buffer.
A practical design often sends both:
- Raw samples for audit, recalibration, and later analysis
- Derived events or summaries for efficient real-time monitoring
4. Streaming to the cloud
The edge device publishes records through a gateway or directly over a network such as cellular, Wi-Fi, Ethernet, LoRaWAN, or satellite. Common application protocols include:
- MQTT: lightweight publish/subscribe messaging, widely used for constrained devices
- CoAP: lightweight request/response communication
- HTTP or HTTPS: simple integration with cloud APIs
- AMQP or proprietary protocols: used where stronger messaging features are required
Devices typically publish to a topic or endpoint organized by site, device, and sensor, for example:
1factory-3/line-2/sensor/temp-01/telemetry
The cloud ingestion service then authenticates the device, validates the message, records ingestion metadata, and places the data into a streaming system, time-series database, data lake, or warehouse.
5. Handling unreliable connectivity
A robust edge-to-cloud pipeline does not assume continuous connectivity. It normally uses:
- Local disk or flash buffering
- Store-and-forward delivery
- Retries with exponential backoff
- Message acknowledgements
- Idempotent writes
- Sequence-number or timestamp-based deduplication
- Back-pressure when the cloud is slow
- Encryption in transit and device authentication
When the connection returns, the gateway uploads buffered readings, often preserving their original event timestamps. This lets the cloud distinguish delayed observations from newly collected data.
End-to-end flow
1Physical environment2 ↓3Sensor samples a signal4 ↓5Edge device records raw value + event timestamp6 ↓7Validation, metadata enrichment, buffering8 ↓9MQTT/HTTPS/other secure stream10 ↓11Cloud ingestion service12 ↓13Time-series store, data lake, dashboards, analytics
The key design principle is to keep event time, ingestion time, and device ordering separate. The edge captures what happened and when; the cloud provides durable storage, fleet-wide analytics, monitoring, and long-term processing. Edge systems may filter or summarize data because sending every reading can increase latency and bandwidth costs, but important raw data can still be retained and forwarded when required. 1
5
8
Related
How do statisticians trace bias and variance back to the initial data sampling frame? https://lastdatabase.com
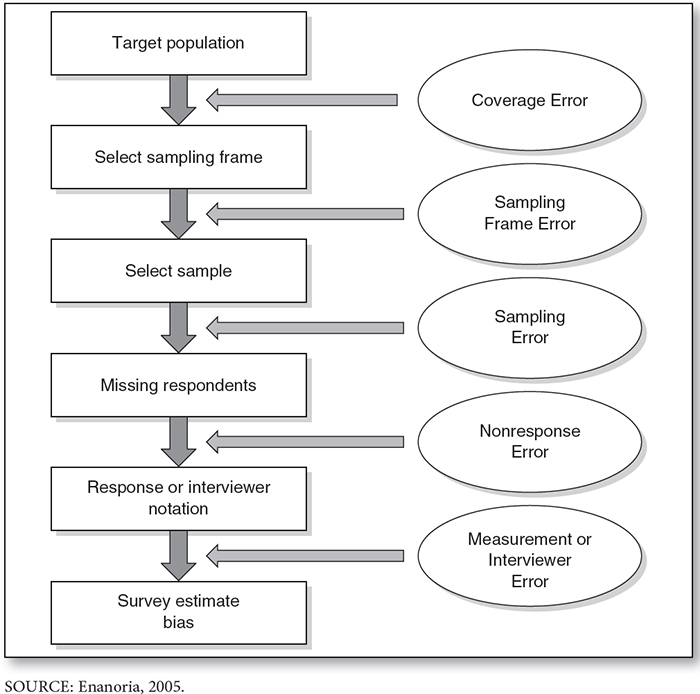
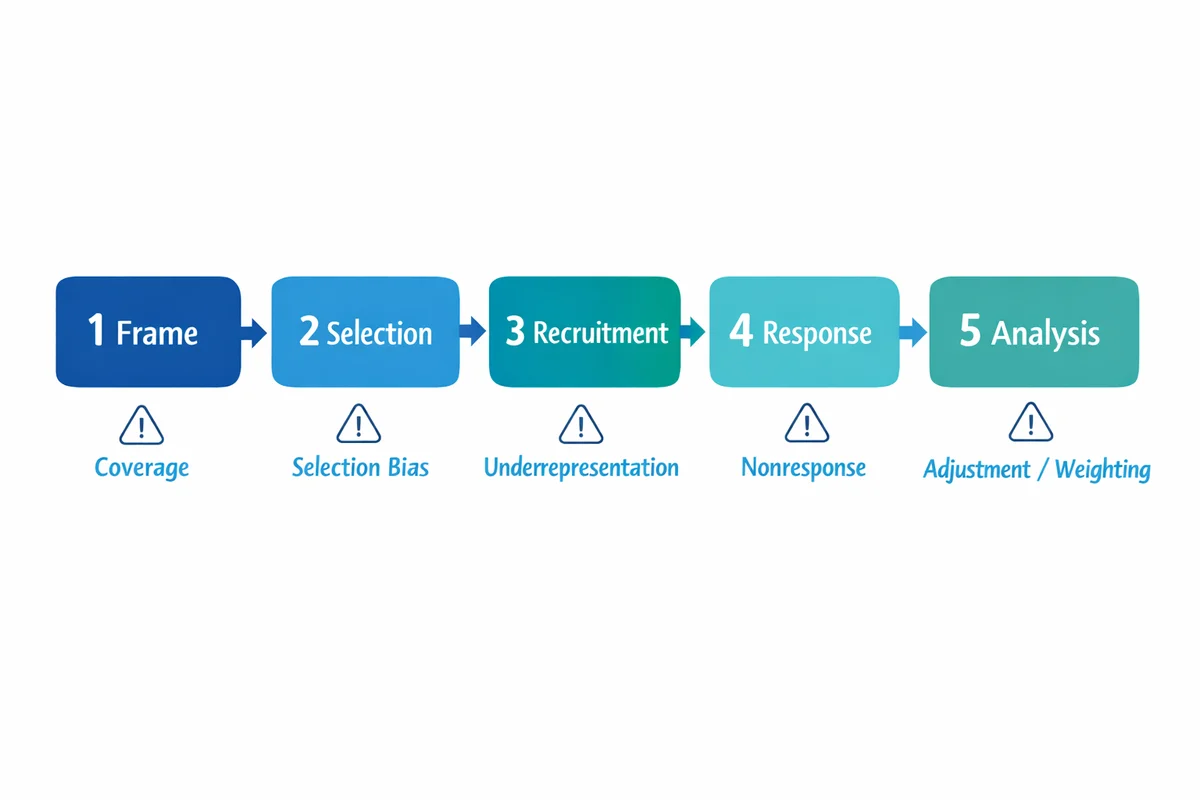
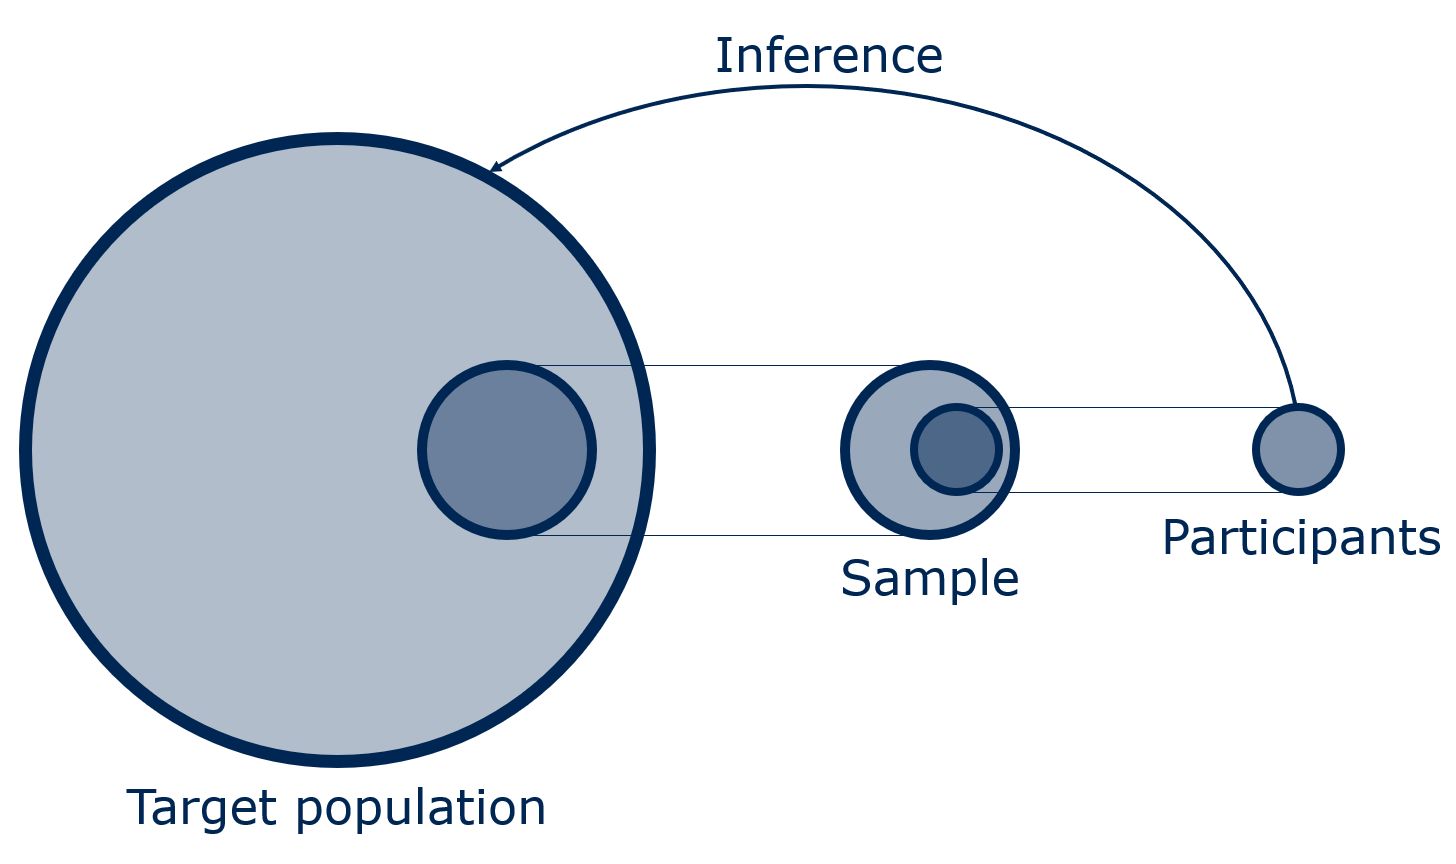
Statisticians trace bias and variance through the chain:
1Target population2 ↓3Sampling frame4 ↓5Sample design and selection6 ↓7Respondents / observed units8 ↓9Estimator and weighting10 ↓11Reported estimate
The key distinction is:
- Bias is systematic displacement from the target-population value.
- Variance is how much the estimate would change across repeated samples. Sampling error is specifically this sample-to-sample variability.
14
1. Start by defining the target population
They first specify exactly what the estimate is meant to describe—for example, all adults living in a country on a given date—and define the target parameter, such as the population mean or proportion.
This creates a benchmark against which bias can be assessed:
[ \text{Bias} = E(\hat{\theta})-\theta ]
where (\theta) is the true target-population quantity and (\hat{\theta}) is the estimator.
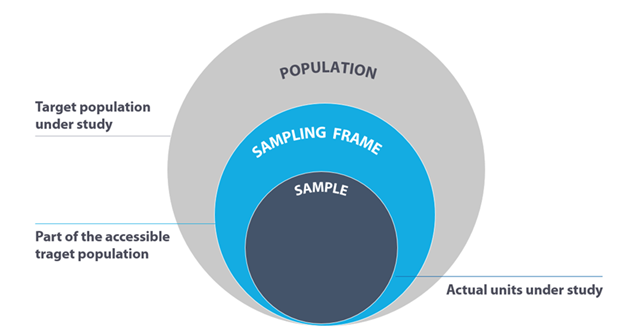
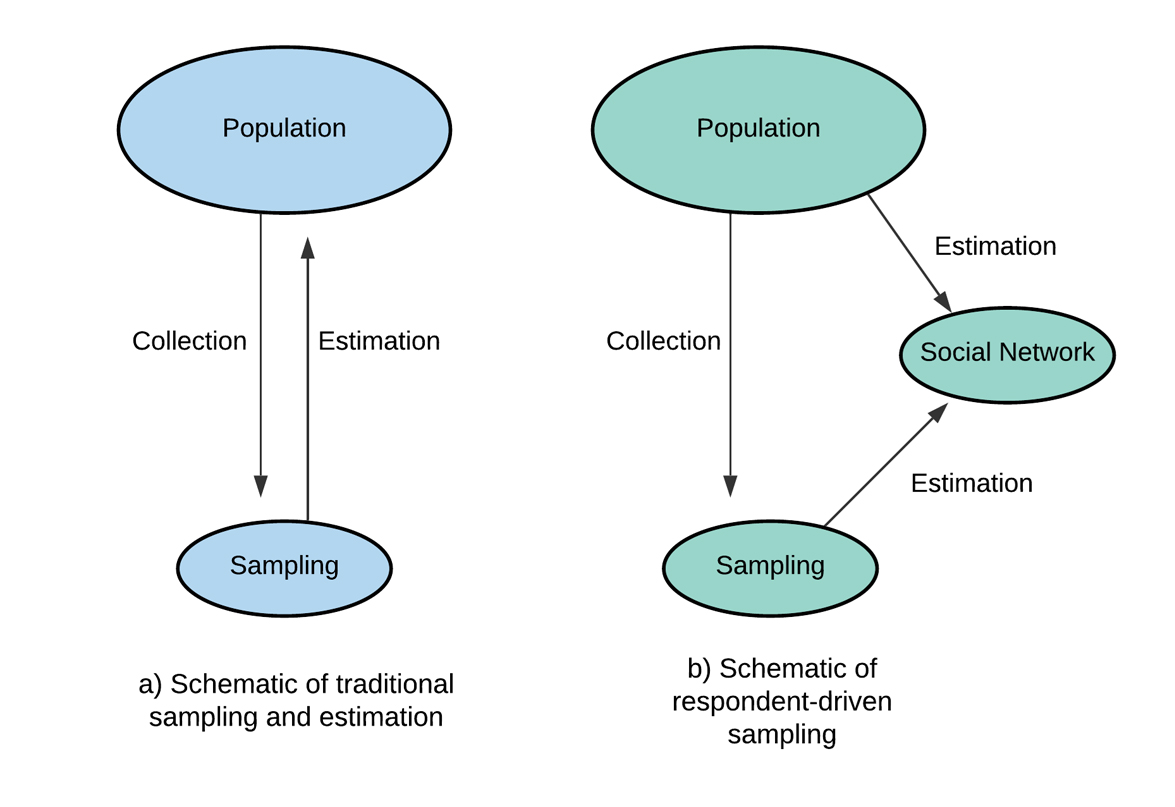
2. Compare the sampling frame with the target population
The sampling frame is the list or mechanism from which units can actually be selected. Statisticians audit:
- Undercoverage: eligible units missing from the frame
- Overcoverage: ineligible or duplicate units included
- Outdated records
- Incorrect eligibility classifications
- Unequal chances of appearing on the frame
- Geographic, demographic, or socioeconomic gaps
A mismatch between the frame and target population is coverage error; the resulting difference in estimates is coverage bias. It exists even before a particular sample is drawn and could affect a census using the same flawed frame. 1
For a simple frame-coverage check, they compare frame and population distributions on known auxiliary variables:
[ \text{coverage rate for group }g
\frac{\text{number of target units in frame group }g} {\text{number of target units in population group }g} ]
Large differences suggest potential bias, especially when the omitted groups differ on the outcome being measured.
3. Trace selection probabilities and design variance
For every sampled unit, the design specifies an inclusion probability (\pi_i)—the probability that unit (i) is selected. The initial design weight is:
[ w_i=\frac{1}{\pi_i} ]
Statisticians then examine whether the design creates:
- Equal or unequal selection probabilities
- Clustering, such as sampling households within neighborhoods
- Stratification
- Multiple stages of selection
- Small or empty strata
- Dependence among observations
They estimate variance using methods appropriate to the design—Taylor linearization, replicate weights, jackknife, bootstrap, or balanced repeated replication. The resulting design effect compares the variance under the actual complex design with the variance under simple random sampling. 15
Clustering often increases variance because sampled units in the same cluster tend to resemble one another; unequal weights can also increase variance. Thus, a frame may be complete yet still produce low precision if the selection design is inefficient.
4. Follow the frame through nonresponse
Selection from a good frame does not guarantee a representative final sample. Statisticians compare respondents with:
- All sampled units
- Nonrespondents
- Frame records or administrative data
- Earlier survey waves
- Follow-up samples of nonrespondents
If response propensity is related to the outcome, nonresponse creates bias. A high response rate alone does not prove the absence of bias; the relevant question is whether respondents differ systematically from nonrespondents. 2
5
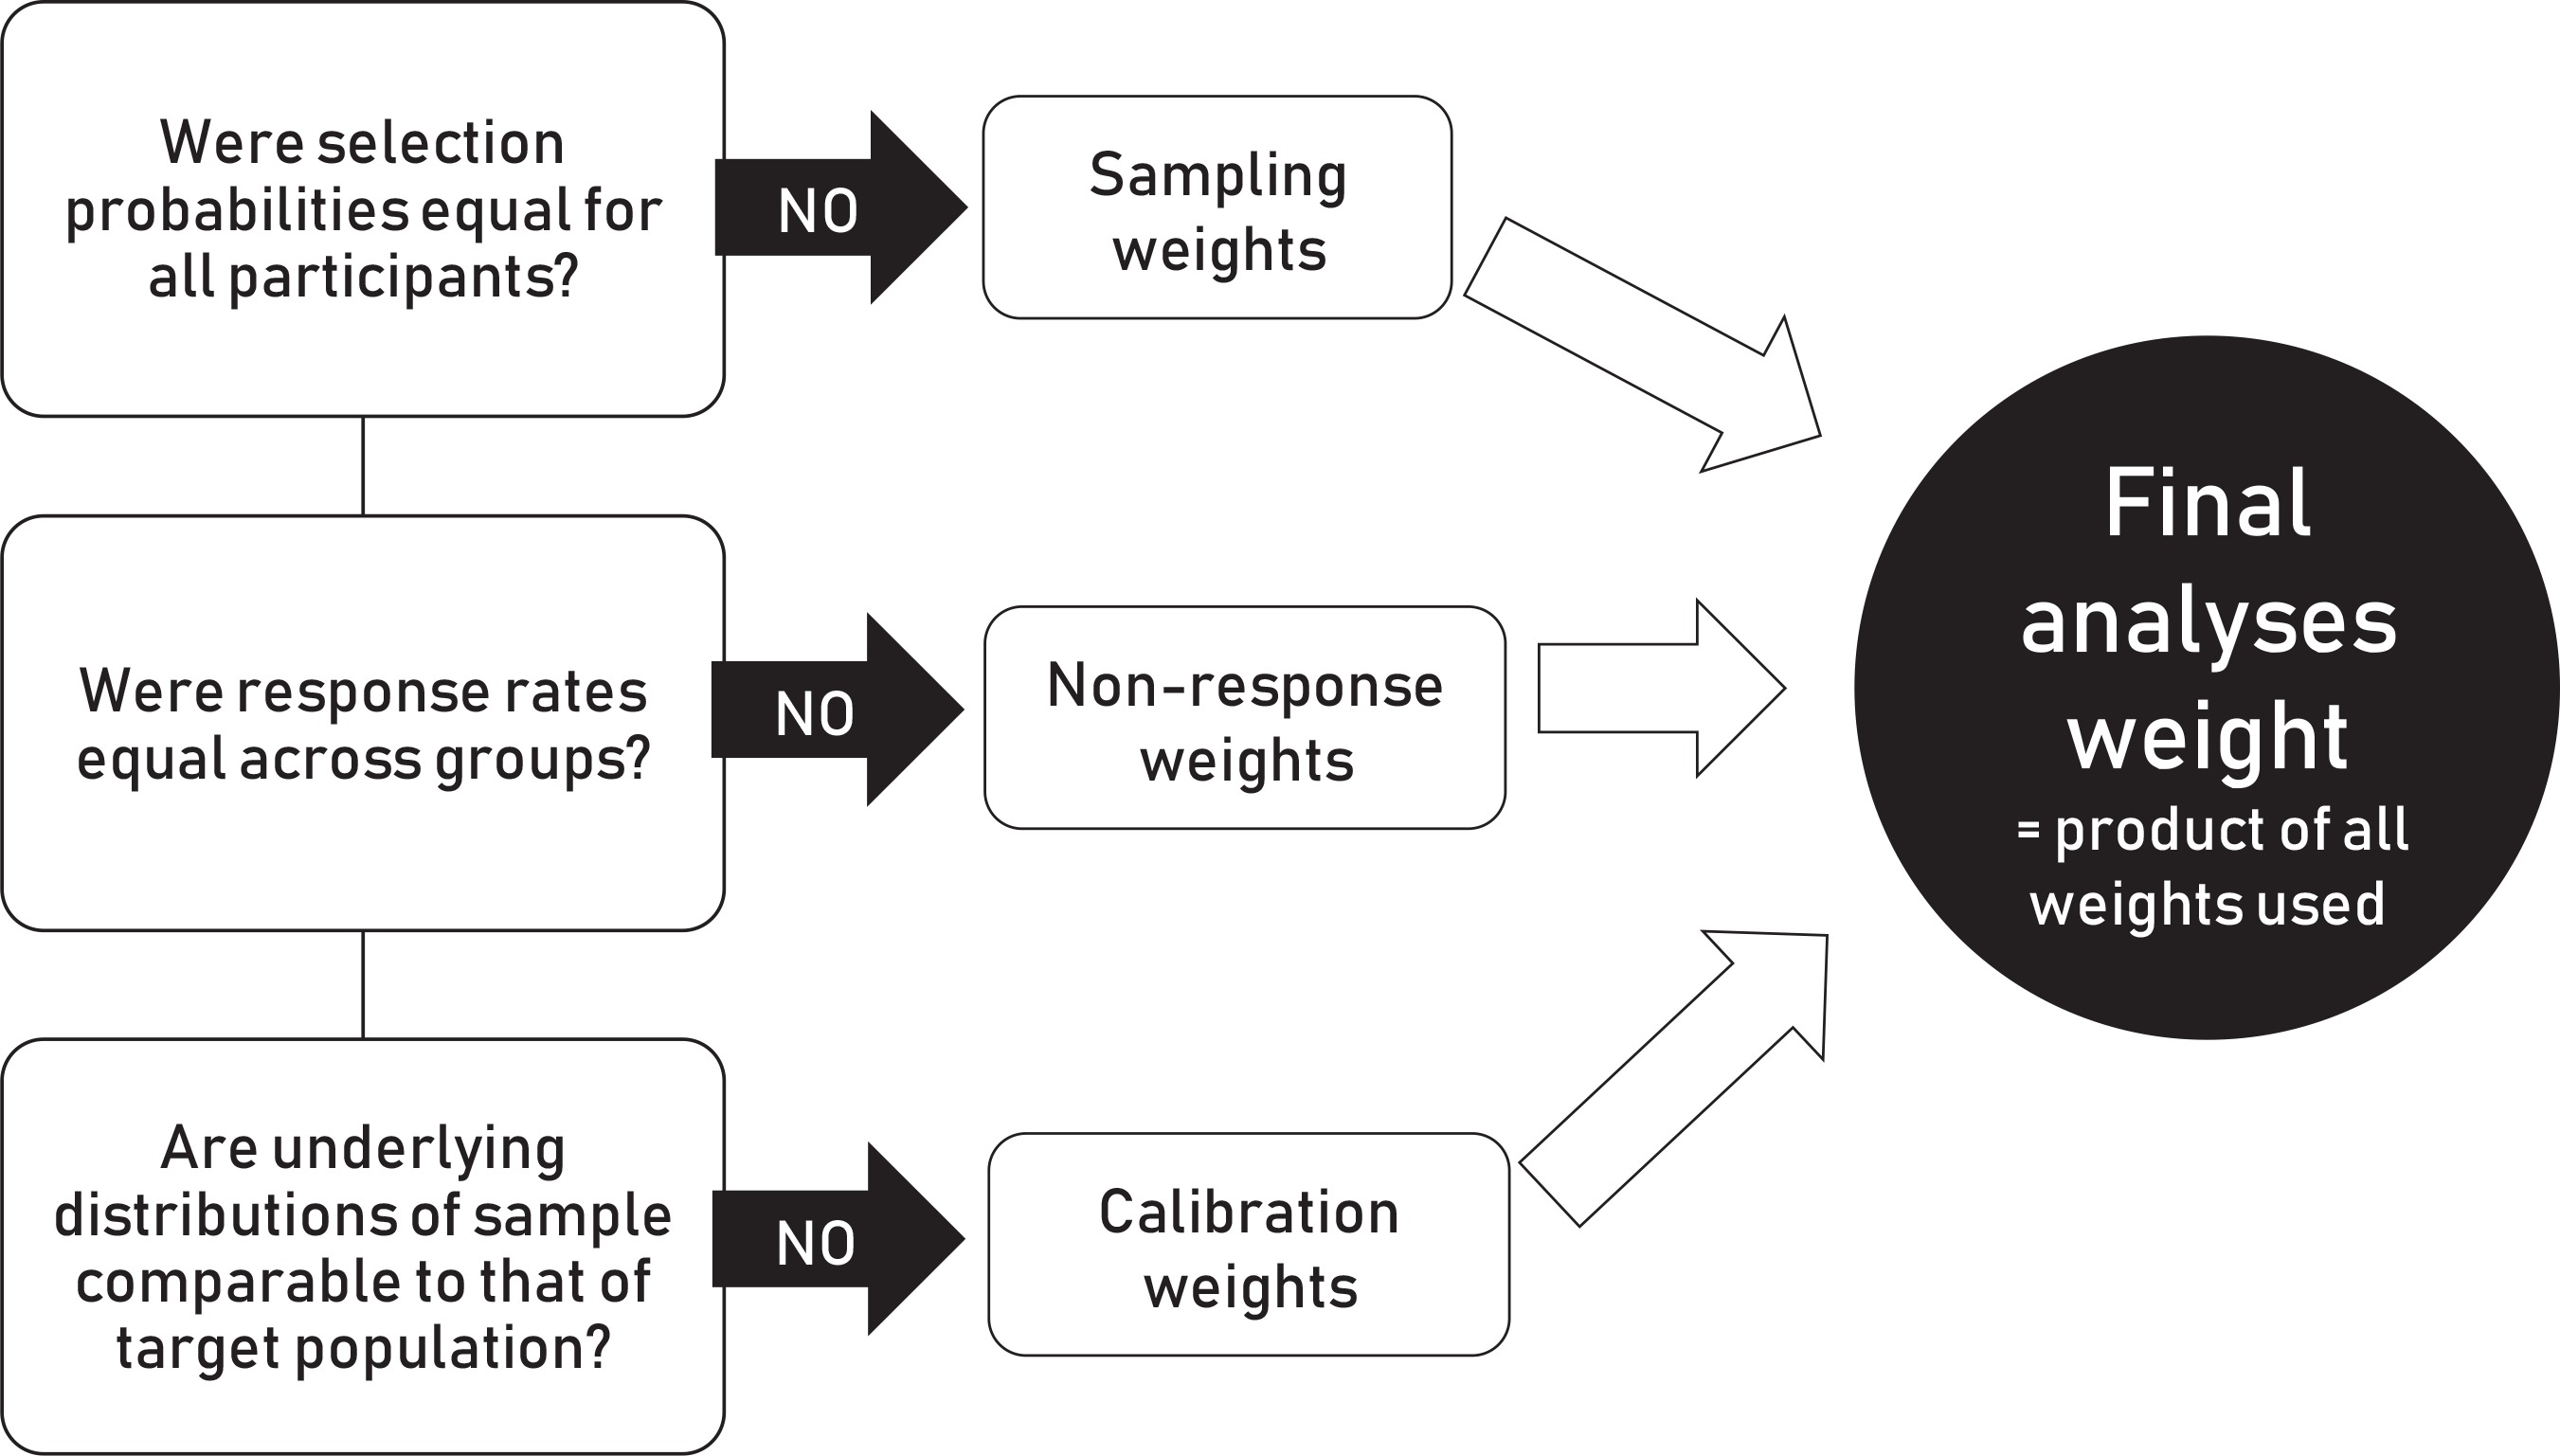
They may model response probabilities and apply nonresponse-adjustment weights:
[ w_i^* = \frac{1}{\pi_i \hat{r}_i} ]
where (\hat{r}_i) is the estimated probability that unit (i) responds.
5. Reweight and check the bias–variance tradeoff
Weights may then be calibrated or raked so the sample matches trusted population totals for age, sex, region, income, or other frame variables. The Census Bureau describes weighting, nonresponse adjustment, variance estimation, and coverage measurement as connected parts of survey inference. 9
Weighting can reduce bias caused by observable coverage or response differences, but highly variable weights generally increase variance. Statisticians therefore inspect:
- Minimum, maximum, and coefficient of variation of weights
- Effective sample size
- Variance before and after adjustment
- Sensitivity to weight trimming
- Estimates under alternative adjustment models
A common diagnostic is:
[ n_{\text{effective}} \approx \frac{(\sum_i w_i)^2}{\sum_i w_i^2} ]
A nominal sample of 10,000 can have a much smaller effective sample size if a few units receive very large weights.
6. Decompose total uncertainty
They report separate components rather than treating all error as “sampling error”:
[ \text{Total error} \approx \text{coverage bias} + \text{selection variance} + \text{nonresponse bias} + \text{measurement bias} + \text{processing error} ]
This is a conceptual decomposition; the components may interact and are not always separately identifiable from one dataset. For example, a biased frame can exclude a group, while the survey questions can independently cause that group’s reported values to be measured incorrectly.
7. Use sensitivity and validation analyses
Because frame-related bias is often not directly observable, statisticians test how conclusions change under plausible assumptions:
- Add or remove suspected undercovered groups
- Compare alternative frames
- Reweight to different population benchmarks
- Vary nonresponse models
- Compare respondents with follow-up nonrespondents
- Link to administrative records
- Conduct capture–recapture or coverage studies
- Simulate repeated samples under the actual design
The result is an audit trail from the original frame to the final estimate:
1Frame exclusions → coverage-bias estimate2Selection probabilities → design weights and variance3Cluster/strata structure → design effect4Nonresponse patterns → response adjustment and residual bias5Weight variability → effective sample size6Alternative assumptions → sensitivity range
In short: statisticians trace bias by asking who could not enter the sample, who failed to respond, and whether those groups differ from observed units. They trace variance by asking how the frame and selection design distribute inclusion probabilities, clustering, and weights across repeated samples. A large sample can sharply reduce variance while leaving frame-induced bias almost unchanged—making a precise estimate consistently wrong. 3
6
Related

Ask your own follow-ups
Komo answers with sources. Pick up this thread in your own history and keep digging.