Shared search · Sep 14, 2026
How can businesses use database information to map target markets?
Businesses can use database information to identify, visualize, and prioritize target markets rather than marketing to everyone.
Practical approach
-
Collect relevant data Combine customer records, purchase history, website behavior, surveys, census data, industry reports, and competitor information. Useful fields include age, income, location, lifestyle, attitudes, business type, spending, and buying behavior.
5
7
-
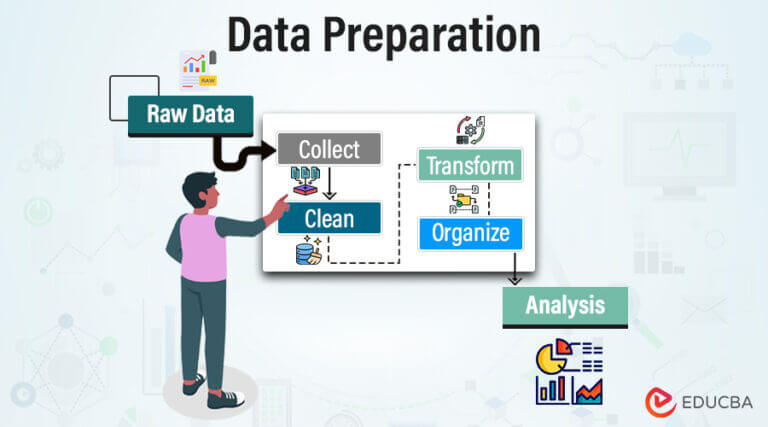
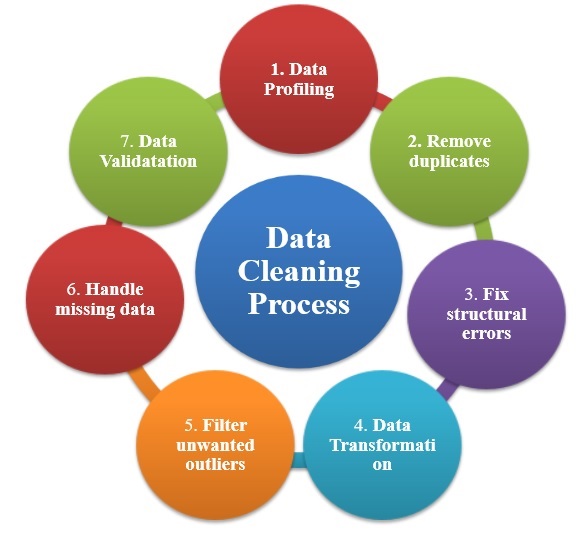
Clean and organize the database Remove duplicates, correct inaccurate addresses, standardize categories, and update outdated records. Add geographic identifiers such as ZIP codes, neighborhoods, census tracts, or GPS coordinates.
-
Segment customers and prospects Group records by shared characteristics, such as:
- Demographics: age, income, household size
- Geography: city, ZIP code, distance from a store
- Psychographics: values, interests, lifestyle
- Behavior: purchase frequency, product usage, response to promotions
- Firmographics for B2B: industry, company size, revenue, and location
Target-market analysis commonly combines demographic and psychographic data to create clear customer profiles.
2
-
Map segments geographically Plot customers, prospects, competitors, and sales by area using mapping or GIS software. Color-coding ZIP codes or census tracts can reveal geographic concentrations and gaps; databases can support site evaluation, demographic analysis, segmentation, and sales forecasting.
3
-
Measure market opportunity Compare the number of potential customers with population, income, demand, or existing competitors. For local businesses, metrics such as businesses per capita, competitor density, and neighborhood-level counts can help identify underserved or saturated areas.
4
-
Build priority territories Rank areas according to factors such as:
- Number and value of likely customers
- Current sales or conversion rates
- Competitor presence
- Travel distance and distribution costs
- Expected demand and growth
- Accessibility through advertising or sales channels
-
Tailor marketing activities Use the results to select the right message, product offer, price, channel, and sales territory for each segment. Database marketing allows lists to be organized precisely for different campaigns.
1
-
Test and update Run campaigns in selected areas, track responses and sales, and feed the results back into the database. Recalculate segments regularly because customer behavior, competitors, and local populations change.
Example
A retailer could map existing customers by ZIP code, overlay household income and age data, and mark competitor locations. It might discover that one neighborhood has many likely customers but few competitors. The business could then test localized advertising, delivery, or a new store there.
Important: Use consent-based data collection, protect personal information, and comply with applicable privacy and marketing laws. Also validate database findings with surveys, interviews, or other primary research; databases can show where a market is, but not always why people buy.
Related
Can Last Database support opportunity identification across business categories?
How can teams organize potential opportunities using database records?
Teams can organize potential opportunities by turning database records into a structured opportunity pipeline.
1. Create a standard opportunity record
Each opportunity should have consistent fields, such as:
- Opportunity ID and name
- Business category or market
- Customer or account
- Geographic area
- Problem or need
- Product or service fit
- Estimated market size or revenue
- Source of the opportunity
- Owner
- Stage
- Priority
- Expected close or launch date
- Next action
- Last updated date
Standardized fields make opportunities easier to search, compare, filter, and report.
2. Group opportunities into categories
Useful categories may include:
- New customer segments
- Geographic expansion
- Cross-selling and upselling
- New products or services
- Partnerships
- Competitor weaknesses
- Operational improvements
- Underserved customer needs
Teams can also classify records by industry, customer type, company size, product line, or strategic objective.
3. Use pipeline stages
A simple workflow might be:
- Identified
- Validated
- Qualified
- Prioritized
- In development
- Pilot or proposal
- Won, launched, deferred, or rejected
Each stage should have clear criteria. For example, an opportunity should not move from “identified” to “qualified” until the team confirms customer demand, likely value, and organizational fit.
4. Score and rank opportunities
A scoring model can assign points for:
- Market potential
- Customer need
- Revenue or cost-saving potential
- Strategic fit
- Competitive advantage
- Ease of implementation
- Confidence in the available data
- Risk and regulatory complexity
Teams can calculate a weighted score, for example:
Priority score = value × strategic fit × confidence ÷ effort and risk
This helps prevent the database from becoming only a list of ideas.
5. Link related records
Connect each opportunity to supporting records, including:
- Customers and prospects
- Sales activities
- Survey responses
- Market research
- Competitors
- Geographic areas
- Products
- Financial estimates
- Tasks and documents
These relationships provide the evidence and context needed for decision-making.
6. Provide role-based views
Different teams need different views:
- Executives: highest-value opportunities and expected return
- Sales: account-level opportunities and next actions
- Marketing: segments, campaign sources, and response rates
- Product teams: customer needs and feature requests
- Finance: forecast value, costs, and assumptions
- Operations: resources, dependencies, and implementation status
A dashboard, kanban board, spreadsheet view, or map can all use the same underlying records.
7. Maintain data quality and accountability
Assign an owner to every opportunity and require regular updates. Use controlled categories, duplicate checks, validation rules, and timestamps. Archive opportunities that are no longer viable while preserving the reason they were closed.
Example structure
| Opportunity | Category | Market | Estimated value | Stage | Score | Owner | Next action |
|---|---|---|---|---|---|---|---|
| Delivery service for suburban customers | Geographic expansion | Suburban households | $500,000 | Qualified | 82 | Operations lead | Test two ZIP codes |
| Add-on analytics package | Cross-sell | Existing B2B clients | $240,000 | Validated | 74 | Account team | Interview 10 customers |
| Partnership with local distributor | Partnership | Regional retail | $350,000 | Identified | 61 | Partnerships lead | Assess partner fit |
The key is to make each record comparable, evidence-based, owned, and connected to a next action. That turns database information into a practical system for discovering and managing opportunities across business categories.
Related
What research value does Last Database provide for opportunity mapping?
How can lastdatabase.com support data preparation for internal teams?





Ask your own follow-ups
Komo answers with sources. Pick up this thread in your own history and keep digging.