Shared search · Sep 14, 2026
i dont understand this . 1.3.1 Convenience Samples Some persons who are conducting surveys use the first set of population units they encounter as the sample. The problem is that the population units that are easiest to locate or collect may differ from other units in the population on the measures being studied. The sample selection may, unknown to the investigators, depend on some characteristic associated with the properties of interest. For example, a group of investigators took a convenience sample of adolescents to study how frequently adolescents talk to their parents and teachers about AIDS. But adolescents willing to talk to the investigators about AIDS are probably also more likely to talk to other authority figures about AIDS. The investigators, who simply averaged the amounts of time that adolescents in the sample said they spent talking with their parents and teach- ers, probably overestimated the amount of communication occurring between parents and adolescents in the population. 1.3.2 Purposive or Judgment Samples Some survey conductors deliberately or purposively select a “representative” sample. If we want to estimate the average amount a shopper spends at the Mall of America in a shopping trip, and we sample shoppers who look like they have spent an “average” amount, we have deliberately selected a sample to confirm our prior opinion. This type of sample is sometimes called a judgment sample—the investigators use their judgment to select the specific units to be included in the sample. 1.3.3 Self-Selected Samples A self-selected sample consists entirely of volunteers—persons who select themselves to be in the sample. Such is the case in radio and television call-in polls, and in many surveys Selection Bias 7 conducted over the internet. The statistics from such surveys cannot be trusted. At best, they are entertainment; at worst, they mislead. Yet statistics from call-in polls or internet surveys of volunteers are cited as supporting evidence by independent research institutes, policy organizations, news organizations, and scholarly journals. For example, Maher (2008) reported that about 20 percent of the 1,427 people responding to an internet poll (described in the article as an “informal survey” that solicited readers to take the survey on a website) said they had used one of the cognitive- enhancing drugs methylphenidate (Ritalin), modafinil, or beta blockers for non-medical reasons in order to “stimulate their focus, concentration or memory.” As of 2020, the statistic had been cited in more than 200 scientific journal articles, but few of the citing articles mentioned the volunteer nature of the original sample or the fact that the statistic applies only to the 1,427 persons who responded to the survey and not to a more general population. In fact, all that can be concluded from the poll is that about 280 people who visited a website said they had used one of the three drugs; nothing can be inferred about the rest of the population without making heroic assumptions. An additional problem with volunteer samples is that some individuals or organizations may respond multiple times to the survey, skewing the results. This occurred with an in- ternet poll conducted by Parade magazine that asked readers whether they blamed actor Tom Cruise, or whether they blamed the media, for his “disastrous public relations year” (United Press International, 2006, reporting on the poll, mentioned an incident in which Cruise had jumped on the couch during Oprah Winfrey’s television show). The editors grew suspicious, however, when 84 percent of respondents said the media—not Cruise—was to blame. The magazine’s publicist wrote: “We did some investigating and found out that more than 14,000 (of the 18,000-plus votes) that came in were cast from only 10 computers. One computer was responsible for nearly 8,400 votes alone, all blaming the media for Tom’s troubles. We also discovered that at least two other machines were the sources of inordinate numbers of votes . . . . It seems these folks (whoever they may be) resorted to extraordinary measures to try to portray Tom in a positive light for the Parade.com survey.”
This passage is about bad ways to choose a survey sample. If the sample does not fairly represent the whole population, the results may be biased—meaning they consistently lean in one direction.
1. Convenience sample
You survey the people who are easiest to find.
Example: You want to know how students at a school feel about homework, so you ask the first 20 students you see in the cafeteria.
Problem: Those students may be different from students who are absent, busy, or in other parts of the school. The easiest people to reach may not represent everyone.
AIDS example
Researchers asked teenagers how often they discuss AIDS with parents and teachers. The teenagers who agreed to discuss AIDS with researchers may already be more comfortable talking about AIDS.
So, these teenagers may talk about AIDS more often than typical teenagers. If researchers calculate the average using only them, they will probably overestimate how much teenagers communicate with parents and teachers.
Main idea:
Easy-to-find people may not be typical people.
2. Purposive or judgment sample
The researcher personally chooses people whom they believe are “typical” or “representative.”
Example: You want to find the average amount shoppers spend at a mall. You choose shoppers who look like they spent an average amount.
Problem: The researcher may be wrong. They might unconsciously choose people who support their existing opinion.
For example, someone wearing ordinary clothes may have spent $50, while someone wearing expensive clothes may have spent $500. You cannot reliably know how much someone spent just by looking at them.
Main idea:
The researcher’s personal judgment may influence the sample.
3. Self-selected sample
People volunteer themselves for the survey.
Example: A website asks:
“Do you support this new law? Click here to vote.”
Only people who feel strongly, have free time, or happen to visit that website may respond. People with weaker opinions or people who never visit the website may not participate.
Therefore, the respondents may not represent the entire population.
Main idea:
People choose themselves, so the people who respond may be unusual in some way.
Why the internet-poll example is unreliable
Suppose 1,427 people voluntarily answer an online survey, and 20% say they have used certain drugs.
That does not allow us to conclude:
“20% of all people use these drugs.”
The only safe conclusion is:
“About 20% of the 1,427 people who answered this particular online poll said they had used these drugs.”
Why? Because the participants were not randomly selected. They may have been especially interested in the topic or especially likely to have used the drugs.
Also, if about 280 people answered “yes,” that still does not tell us about the rest of the population.
Why multiple responses are a problem
In the Tom Cruise poll, people could vote more than once. One computer submitted thousands of votes.
That means the result did not represent thousands of different people. It represented a small number of people voting repeatedly.
This is similar to asking 100 people for their opinions, but allowing one person to give 80 of the answers. That person’s opinion would have far too much influence.
Simple comparison
| Type of sample | How people are chosen | Main problem |
|---|---|---|
| Convenience | Whoever is easiest to find | Easy-to-find people may differ from everyone else |
| Judgment/purposive | Researcher chooses who seems typical | Researcher may make a biased or incorrect judgment |
| Self-selected | People volunteer themselves | Volunteers may have unusually strong interest or opinions |
The better method
A more reliable survey usually uses a random sample, where members of the population are selected by chance. This gives different types of people a fair opportunity to be included.
In one sentence
All three methods can produce selection bias because the people included in the sample may differ systematically from the larger population the researcher wants to study.
Related
Example 1.4. As of October 2019, more than 1,600 cases of lung injuries associated with use of electronic cigarettes (e-cigarettes) had occurred, including 34 deaths (Moritz et al., 2019), but the cause of the injuries was unknown. Lewis et al. (2019) conducted inter- views with 53 patients in Utah who had used e-cigarette products within three months of experiencing lung injury. Forty-nine of them (92 percent) reported using cartridges contain- ing tetrahydrocannabinol (THC is the psychoactive ingredient in marijuana). Most of the THC-containing products were acquired from friends or from illicit dealers. The study authors identified possible sources of selection bias in their report. Although they attempted to interview all 83 patients who were reported to have lung injuries following use of e-cigarettes, only 53 participated, and the nonresponse might cause estimates to be biased. Additional bias might occur because physicians may have reported only the more serious cases, or because THC was illegal in Utah and patients might have underreported its use. Persons with lung injuries who did not seek medical care were excluded from the study. The sample used in the study was likely not representative of e-cigarette users with lung injuries in the United States as a whole, or even in Utah. But even with the selection bias, the sample provided new information about the lung injuries. The majority of the persons with lung injury in the sample had been using e- cigarettes containing THC, and this finding led the authors to recommend that the public stop using these products, pending further research. The purpose of the sample was to provide timely information for improving public health, not to produce statistics describing the entire population of e-cigarette users, and the data in the sample provided a basis for further investigations.
Example 1.4. As of October 2019, more than 1,600 cases of lung injuries associated with use of electronic cigarettes (e-cigarettes) had occurred, including 34 deaths (Moritz et al., 2019), but the cause of the injuries was unknown. Lewis et al. (2019) conducted inter- views with 53 patients in Utah who had used e-cigarette products within three months of experiencing lung injury. Forty-nine of them (92 percent) reported using cartridges contain- ing tetrahydrocannabinol (THC is the psychoactive ingredient in marijuana). Most of the THC-containing products were acquired from friends or from illicit dealers. The study authors identified possible sources of selection bias in their report. Although they attempted to interview all 83 patients who were reported to have lung injuries following use of e-cigarettes, only 53 participated, and the nonresponse might cause estimates to be biased. Additional bias might occur because physicians may have reported only the more serious cases, or because THC was illegal in Utah and patients might have underreported its use. Persons with lung injuries who did not seek medical care were excluded from the study. The sample used in the study was likely not representative of e-cigarette users with lung injuries in the United States as a whole, or even in Utah. But even with the selection bias, the sample provided new information about the lung injuries. The majority of the persons with lung injury in the sample had been using e- cigarettes containing THC, and this finding led the authors to recommend that the public stop using these products, pending further research. The purpose of the sample was to provide timely information for improving public health, not to produce statistics describing the entire population of e-cigarette users, and the data in the sample provided a basis for further investigations.
This example shows an important point:
A study can have selection bias and still be useful.
It just cannot necessarily be used to describe the whole population accurately.
What happened?
Researchers in Utah studied 53 patients who had lung injuries after using e-cigarette products.
- They tried to contact 83 patients.
- Only 53 participated.
- 49 of the 53 participants—92%—reported using THC products.
The researchers noticed that many of the people in their sample had used THC-containing e-cigarette cartridges.
Why might the sample be biased?
Selection bias occurs when the people included in a study differ systematically from the larger population of interest 3.
Several things could have caused that here:
1. Nonresponse
Only 53 of the 83 patients participated. The 30 people who did not participate might have had different patterns of e-cigarette use.
For example, perhaps people who used THC were more willing to talk—or perhaps they were less willing to talk. We do not know.
So, the 53 participants may not accurately represent all 83 patients. A low response rate can make selection bias possible, although it does not prove that bias occurred 5.
2. Only reported cases were included
Doctors may have reported mostly the more serious cases. People with milder injuries may not have been identified.
Therefore, the study may not represent every person who developed an injury.
3. Some people may have hidden their THC use
THC was illegal in Utah at the time. Some patients might have been afraid to admit using it.
That means the study could actually have underestimated THC use.
4. People who did not seek medical care were missing
The study included patients who came to medical attention. Someone with a lung injury who stayed home or went untreated was not included.
Those people might have had different symptoms, levels of THC use, or illness severity.
What can we conclude?
The researchers cannot safely conclude:
“92% of all people in the United States who suffer e-cigarette lung injuries used THC.”
The 92% figure applies only to:
The 49 out of 53 Utah patients who participated in this study.
The sample was probably not representative of all e-cigarette users with lung injuries in the United States—or even all such users in Utah.
Was the study still useful?
Yes.
The study revealed a strong and concerning pattern: most of the patients studied reported using THC-containing products. That was valuable information because the cause of the injuries was not yet known.
The researchers could use this finding to:
- warn the public,
- recommend avoiding these products,
- investigate THC products more carefully,
- conduct larger and better-designed studies.
The key distinction
The study had two possible purposes:
| Purpose | Was the study useful? |
|---|---|
| Estimate the exact percentage of all injured e-cigarette users who used THC | Probably not, because of selection bias |
| Detect a possible connection and warn people while further research was conducted | Yes |
So the lesson is:
Biased data may be poor for estimating exact population statistics, but they can still reveal an important warning signal.
Also, the study showed an association, not definite proof that THC caused the lung injuries. Other factors—such as ingredients, contamination, or other substances in the cartridges—could also have contributed.
Related
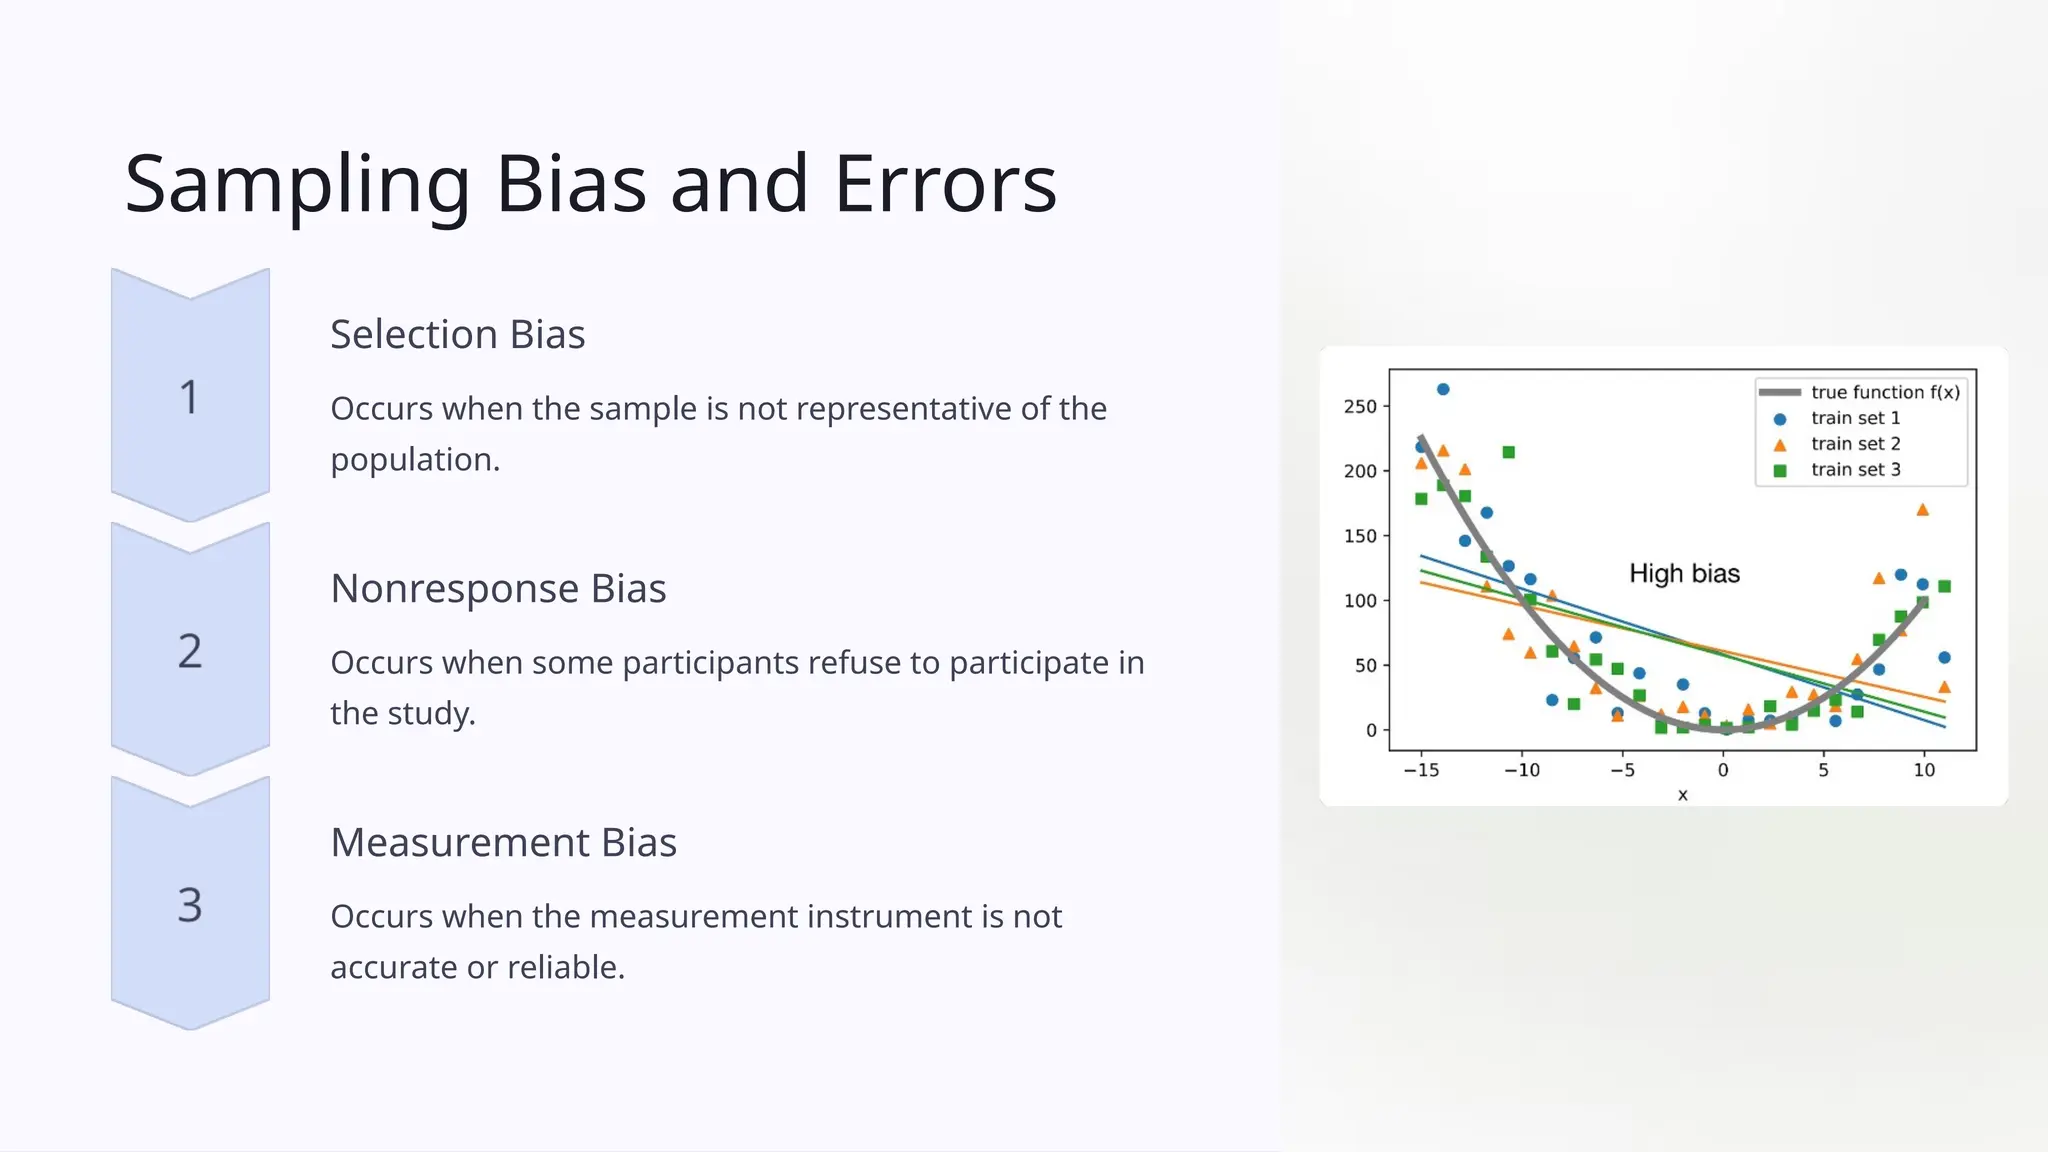
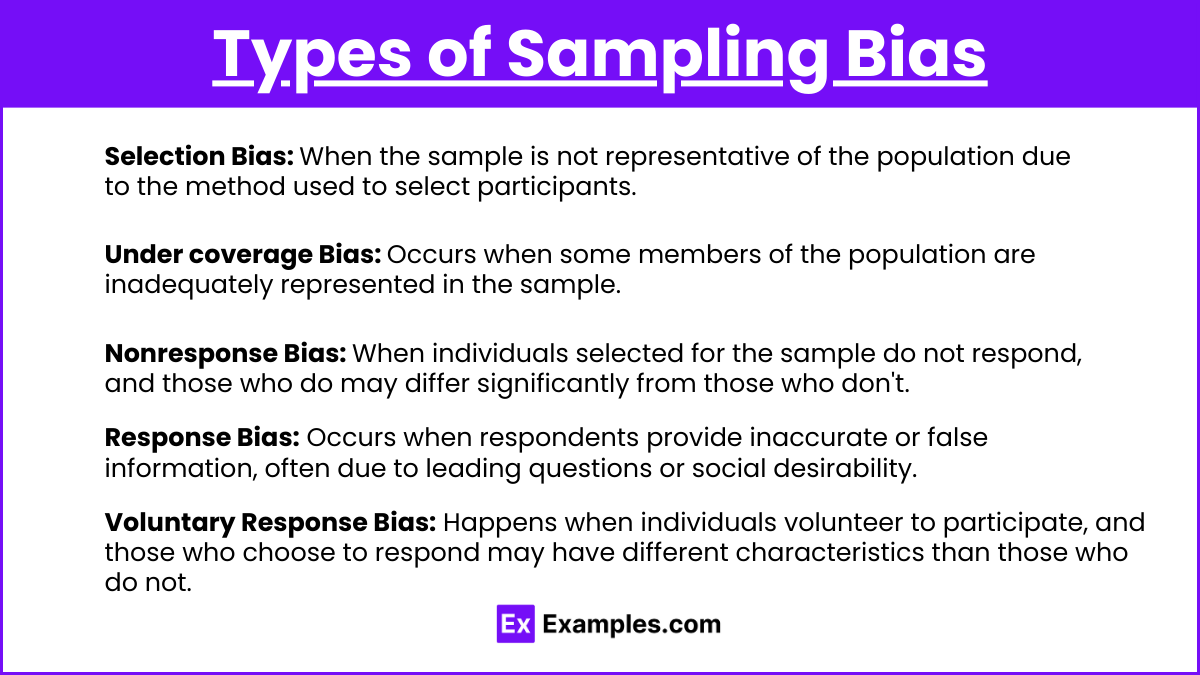
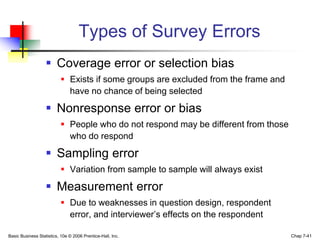
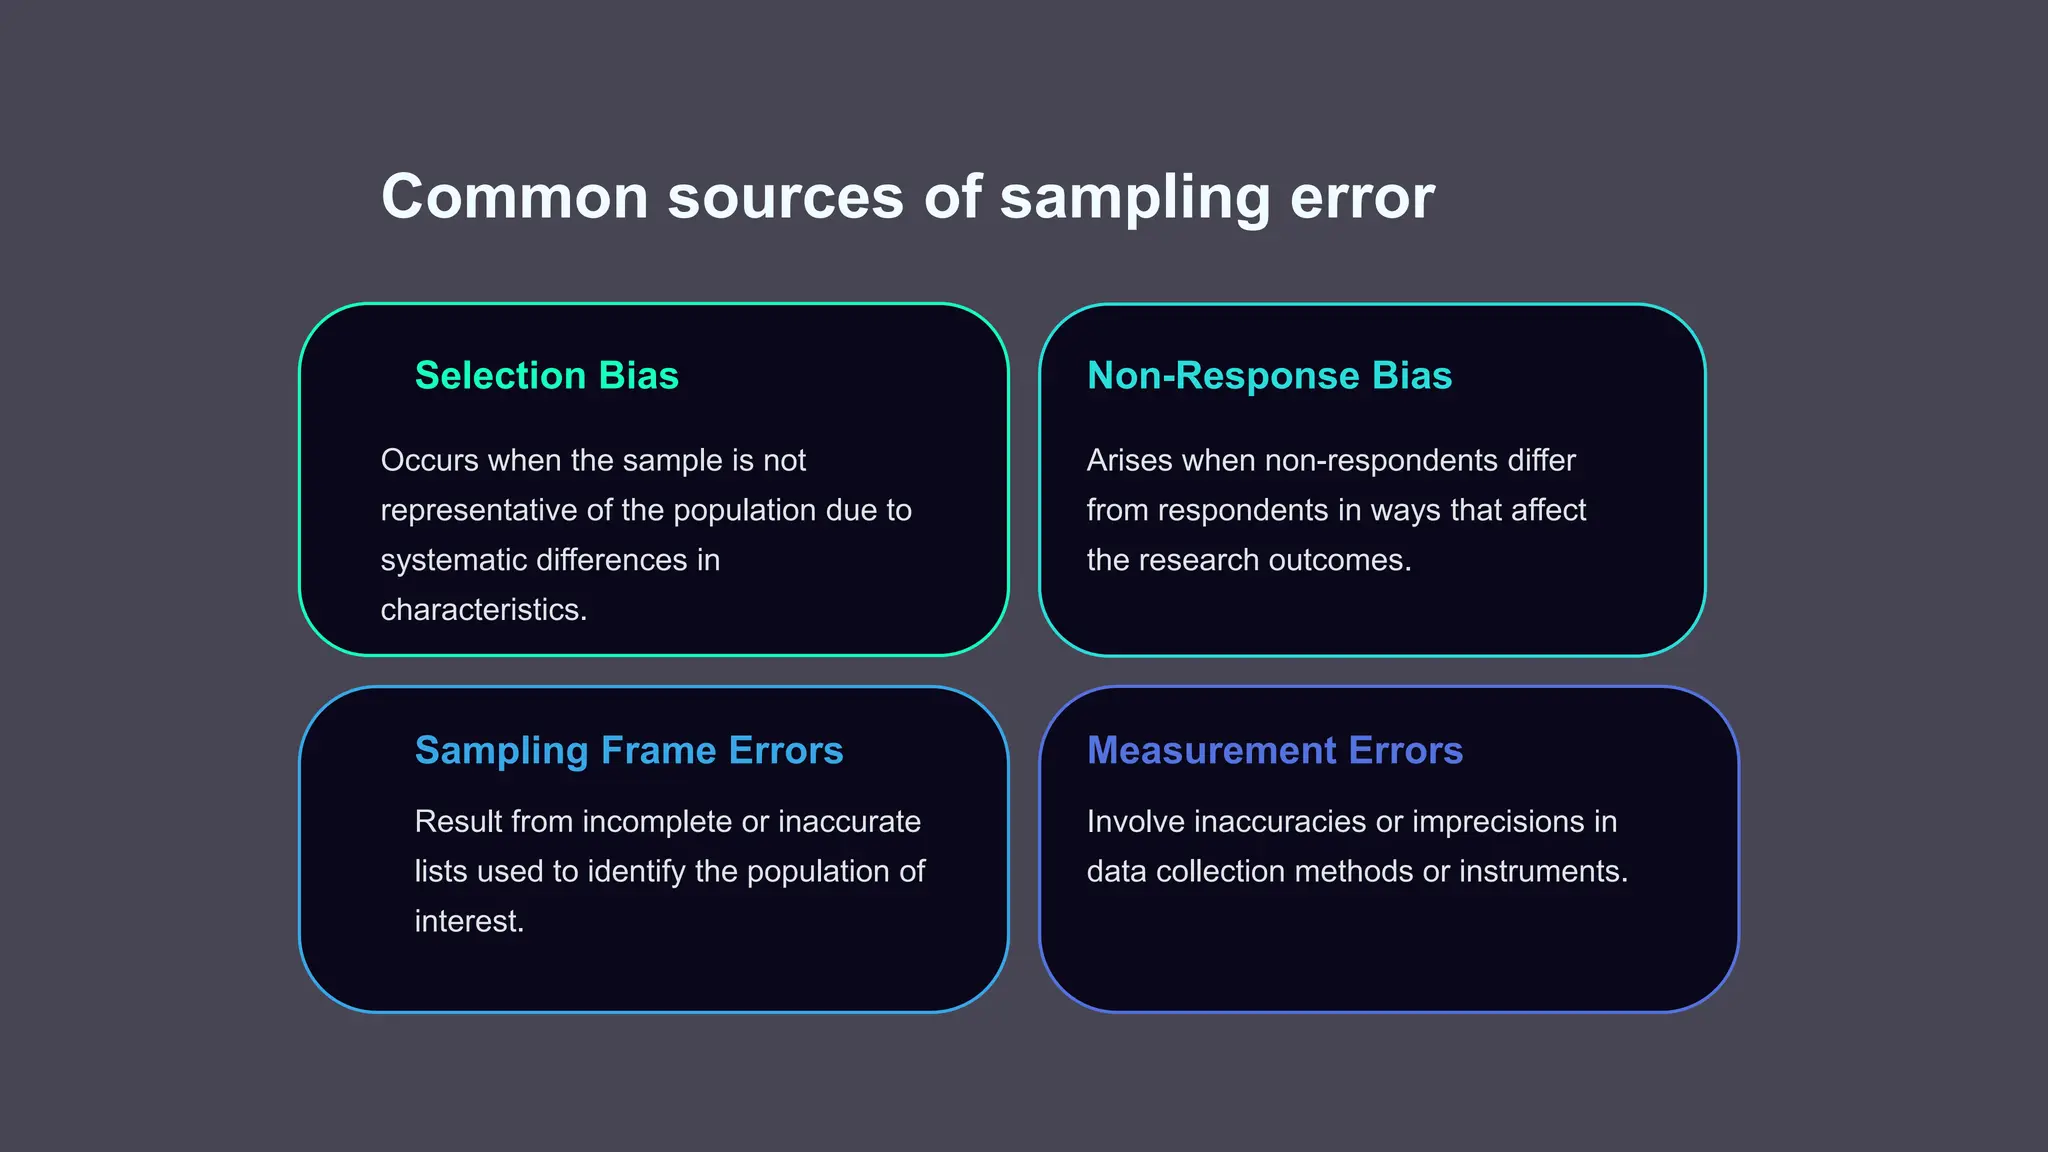
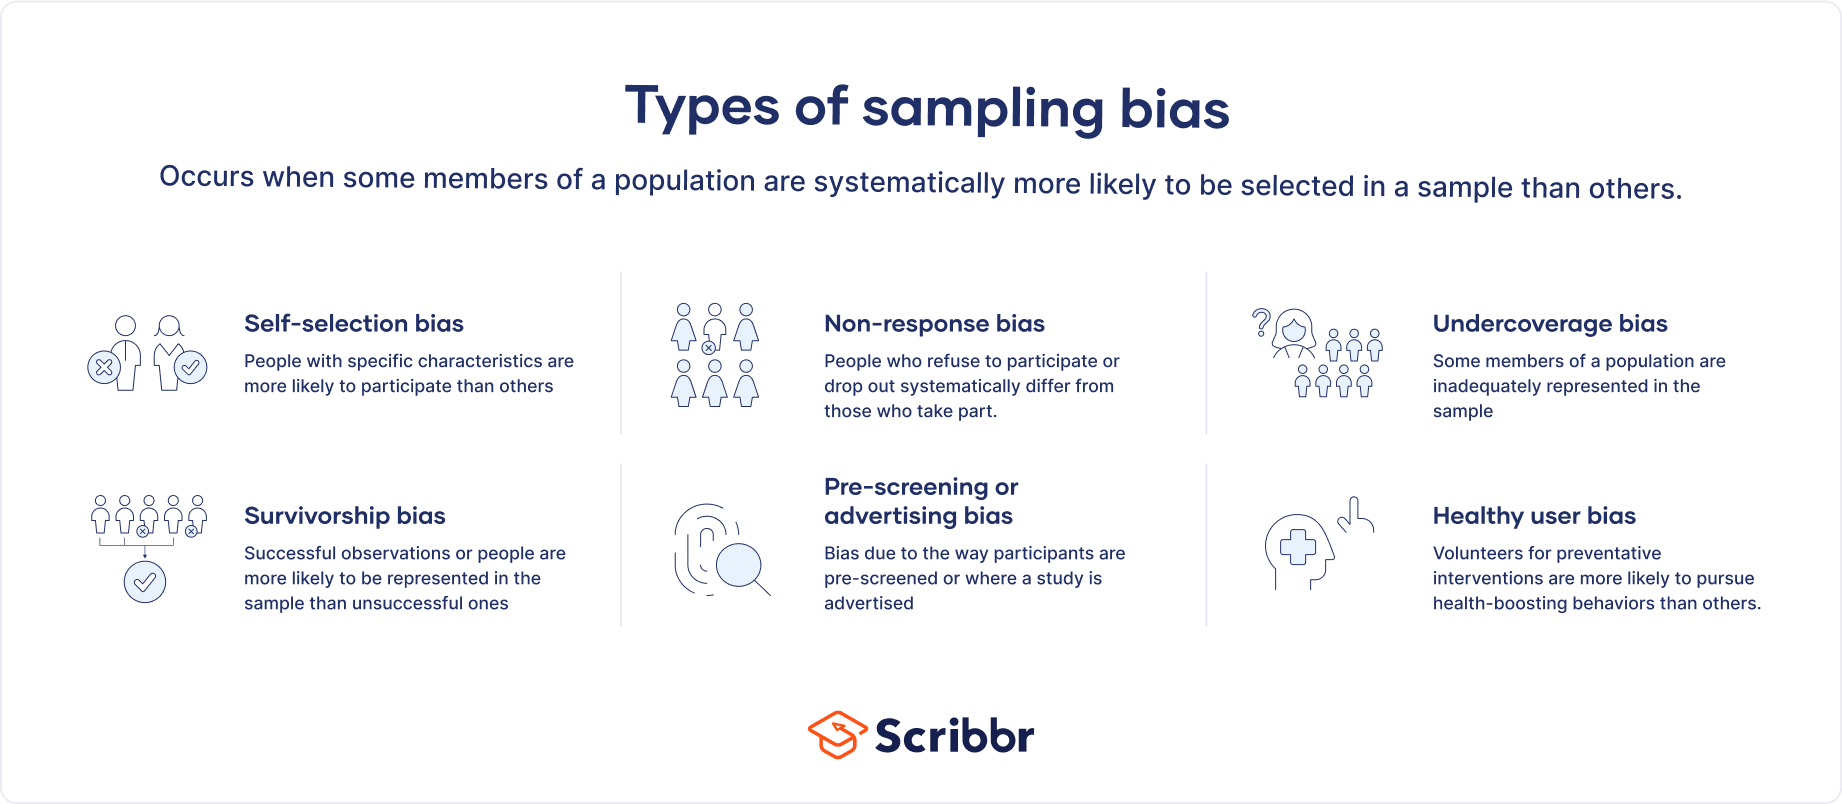
Survey sampling is used in every area of life, but samples must be collected and analyzed carefully for their results to apply to the target population. Statistics from a representative sample can be generalized to the population from which the population was drawn, and can be accompanied by a measure of how accurate the statistics are. Bias is a major concern for samples intended to generalize to the population. Selection bias occurs when some population members are, without the intention of the sampler, over- represented or underrepresented in the sample. Sources of selection bias include undercov- erage (when the sampling frame fails to include part of the target population), overcoverage (when the sample can include units not in the target population), and nonresponse (when units designated for the sample fail to provide data). Self-selected samples (in which per- sons volunteer for the survey) and convenience samples (in which the sample consists of easy-to-locate or easy-to-collect units) often have selection bias. Measurement error occurs when the data recorded for observation units differ from the true values. In surveys of people, question wording and ordering are common sources of measurement error, and these can sometimes be mitigated by careful questionnaire design. Selection bias and measurement error are examples of nonsampling errors. Nonsampling errors can affect any type of data collection, even those that are intended to be a census of the population. It may be possible to reduce nonsampling errors by taking a carefully collected sample, even though estimates from the sample have sampling error because only part of the population is measured.
Main idea
Survey results can be applied to a target population only when the sample is collected in a way that adequately represents that population. A representative sample allows researchers to:
- Generalize sample results to the target population.
- Report a measure of sampling accuracy, such as a margin of error.
However, even a large sample can produce misleading results if it is biased. Bias is systematic and is not automatically fixed by increasing sample size 2.
Selection bias
Selection bias occurs when some members of the target population are unintentionally more or less likely to appear in the sample.
Common sources include:
- Undercoverage: The sampling frame leaves out part of the population.
Example: An online-only survey may miss people without reliable internet access. - Overcoverage: The sampling frame includes people who are not part of the target population, or includes some units more than once.
- Nonresponse: People selected for the sample do not provide data, and those who respond differ meaningfully from those who do not.
- Self-selection: People volunteer to participate, often causing individuals with especially strong opinions or experiences to be overrepresented.
- Convenience sampling: Researchers use people who are easiest to contact or study rather than selecting an appropriate sample.
Nonresponse bias occurs specifically when respondents differ from nonrespondents in ways relevant to the survey; a low response rate alone does not prove that bias exists 1.
Measurement error
Measurement error occurs when the recorded answer differs from the observation unit’s true value.
In surveys, it may result from:
- confusing or leading wording,
- a poor question order,
- ambiguous response choices,
- respondents misunderstanding a question,
- respondents intentionally giving inaccurate answers.
Careful questionnaire design, neutral wording, and appropriate question ordering can help reduce this type of error.
Sampling error versus nonsampling error
| Type of error | Meaning | Example |
|---|---|---|
| Sampling error | Natural variation because only part of the population is surveyed | One random sample estimates 52%, while another estimates 49% |
| Nonsampling error | Problems in collecting or measuring the data | Missing a group, nonresponse, or asking a leading question |
Selection bias and measurement error are nonsampling errors. They can occur even in a census, because a census may still omit people, receive incomplete responses, or record inaccurate information. By contrast, sampling error occurs because a sample—not the entire population—is measured.
Key lesson
A carefully collected sample may have some unavoidable sampling error, but its results can still be generalized with an estimated margin of error. A poorly collected sample may have substantial nonsampling error, and its results may be systematically wrong even if the sample is very large.
Related



Ask your own follow-ups
Komo answers with sources. Pick up this thread in your own history and keep digging.